In retrospect, the past year our team was on a mission to enhance Profiling tools, making them more efficient and user-friendly. We improved instrumentation and our .NET counter tool, broadened platform support, seamlessly integrated unit test profiling, and boosted overall performance. Your valuable feedback via Developer Community was crucial in making Visual Studio’s profiling experience noticeably more intuitive. In this post, you will get a summary of the 2023 changes providing an opportunity to catch up on any enhancements you may have overlooked.
All features listed below are available in our latest Visual Studio version and are accessible across all Visual Studio SKUs unless explicitly stated otherwise.
Contents
- Boost Your Productivity with Improved Instrumentation Tool
- Enhancements Across Profiling Tools
- Test Profiling
- Faster and More Reliable Profiling Tools
- In the Summary
Boost Your Productivity with Improved Instrumentation Tool
The Instrumentation tool has undergone significant improvements, making it faster and more versatile than ever before. Now, it supports C++ code, enhancing the capabilities for performance analysis. The Instrumentation Data View displays a list of functions ordered by duration, streamlining the identification of potential bottlenecks.This feature was inspired by the Developer Community suggestion: Profiling / Instrumentation of C++ CMake application quits immediately with no data captured
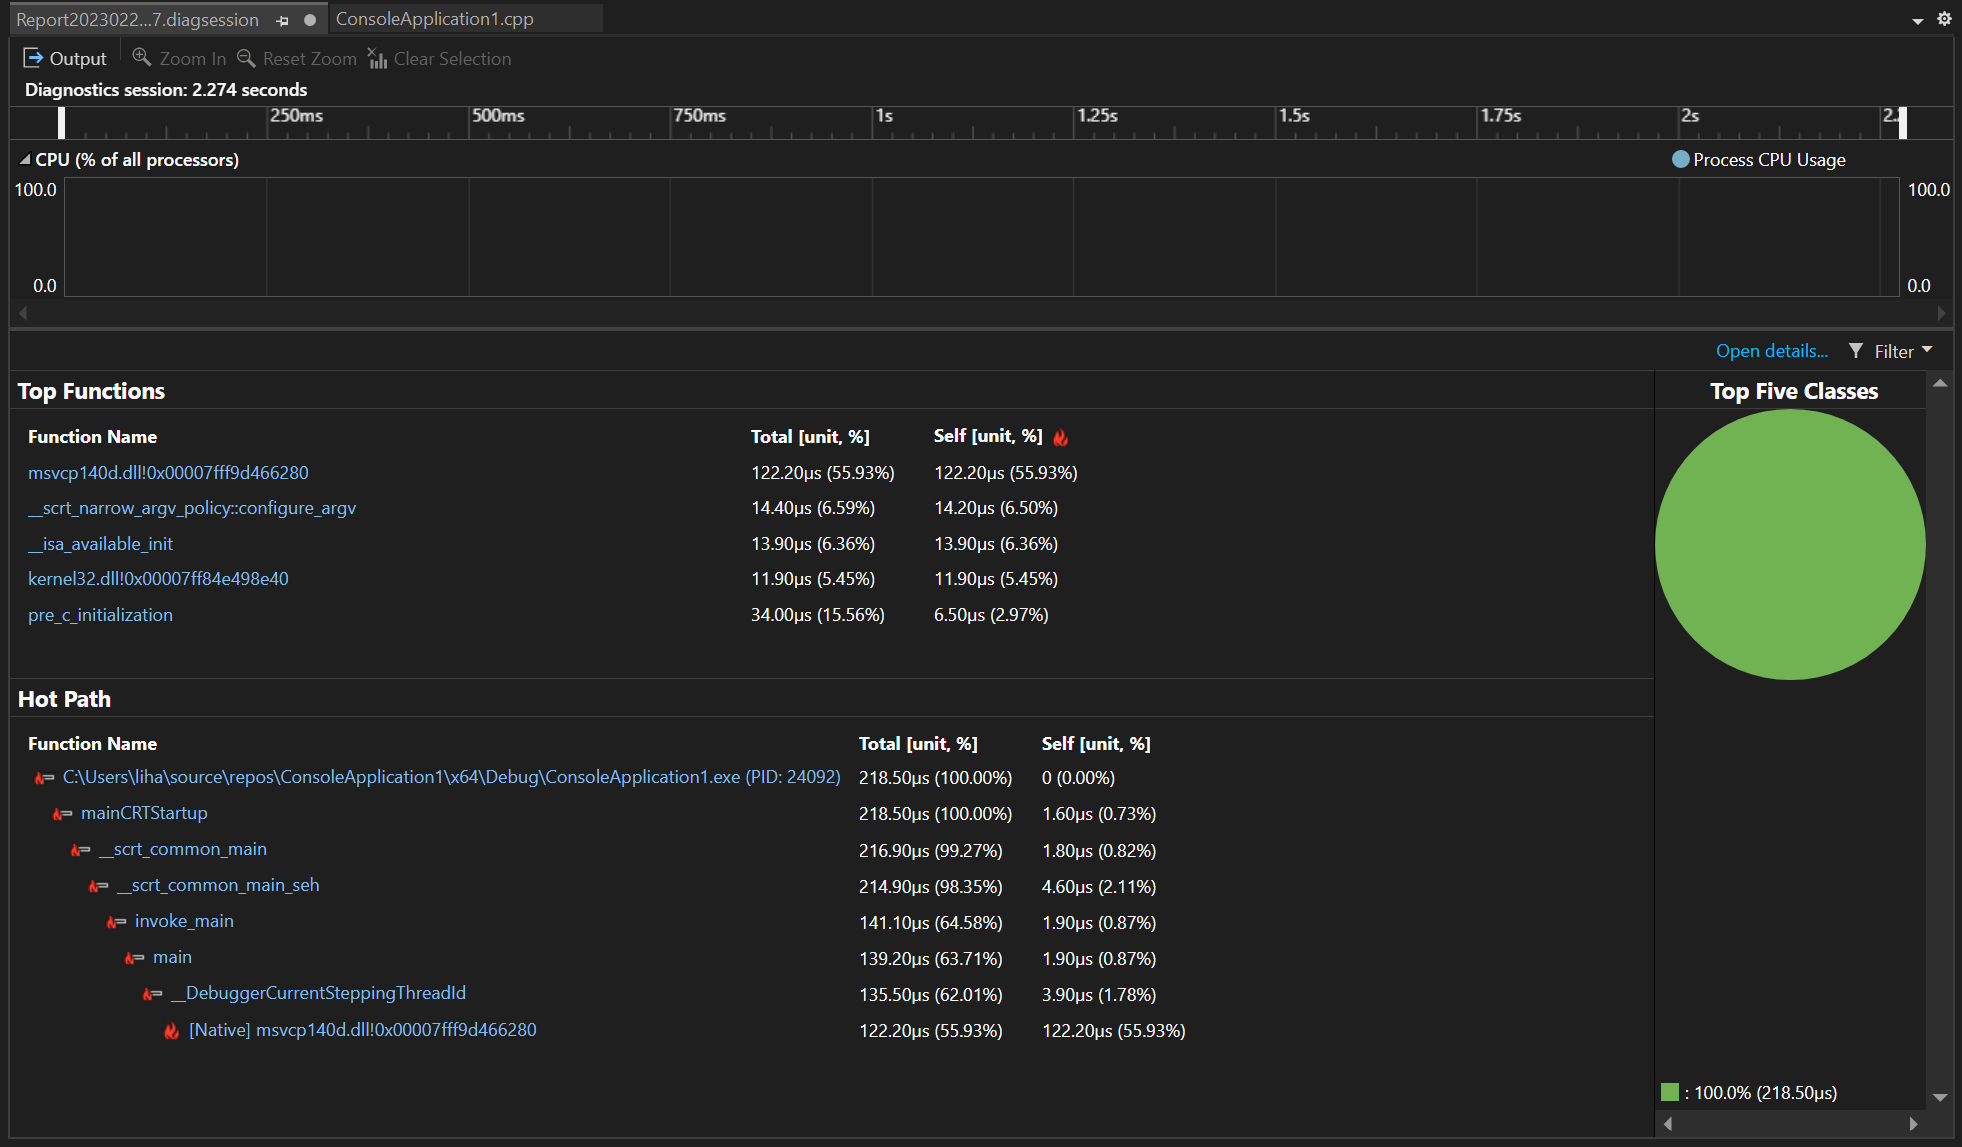 Learn more about these enhancements in our recent blog: Improving Visual Studio performance with the new Instrumentation Tool – Visual Studio Blog (microsoft.com)
Another noteworthy addition is the “Start with collection pause” option, enabling the temporary suspension of data collection during application profiling. This feature proves especially advantageous in scenarios like gaming, where users prefer full immersion before data collection commences. This feature was inspired by the Developer Community suggestion: Support pause for Instrumentation Profiling
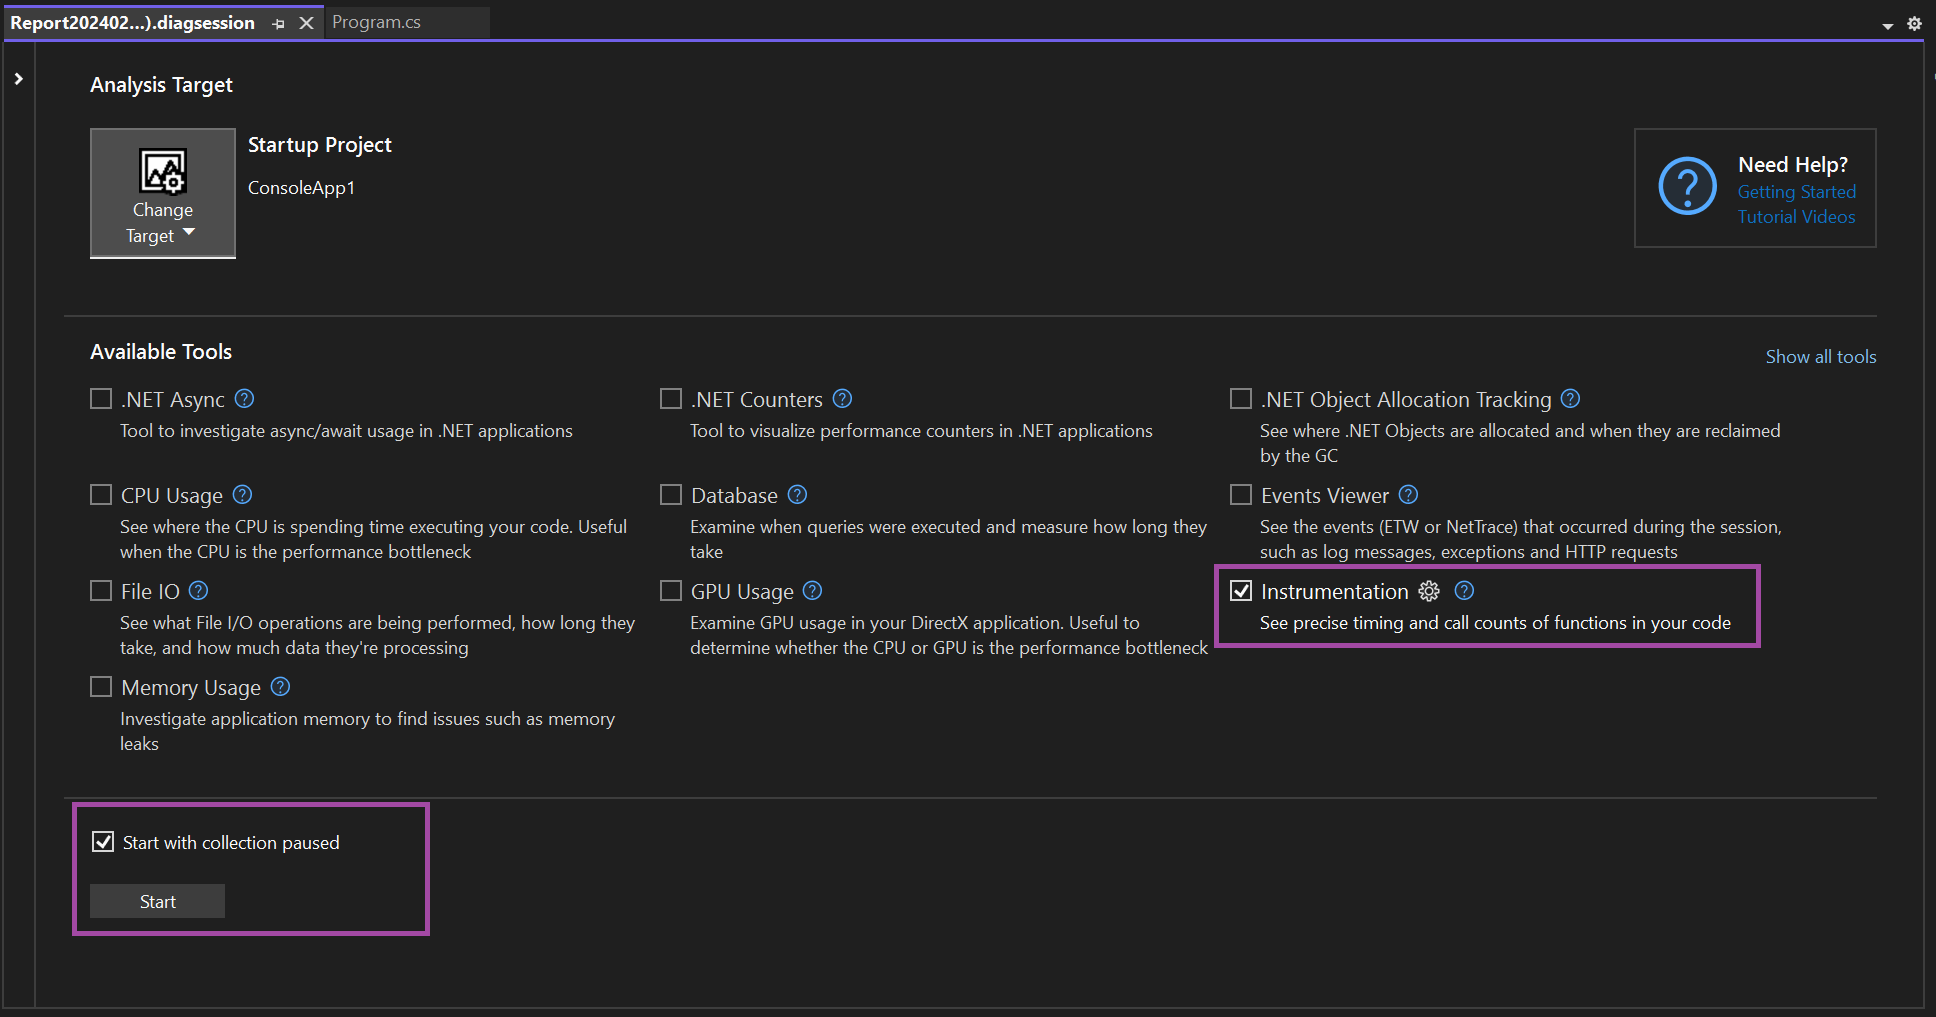
Learn More from our documentation: Analyze CPU usage in the Performance Profiler – Visual Studio (Windows) | Microsoft Learn.
Enhancements Across Profiling Tools
.NET Counters Tool in Debugging Scenario
You can easily access the .NET Counter from the diagnostics window by picking the “.NET Counters” option from the “Select Tool” dropdown menu. You can also use the features of .NET Counters to monitor and evaluate important performance metrics while you are debugging your code.
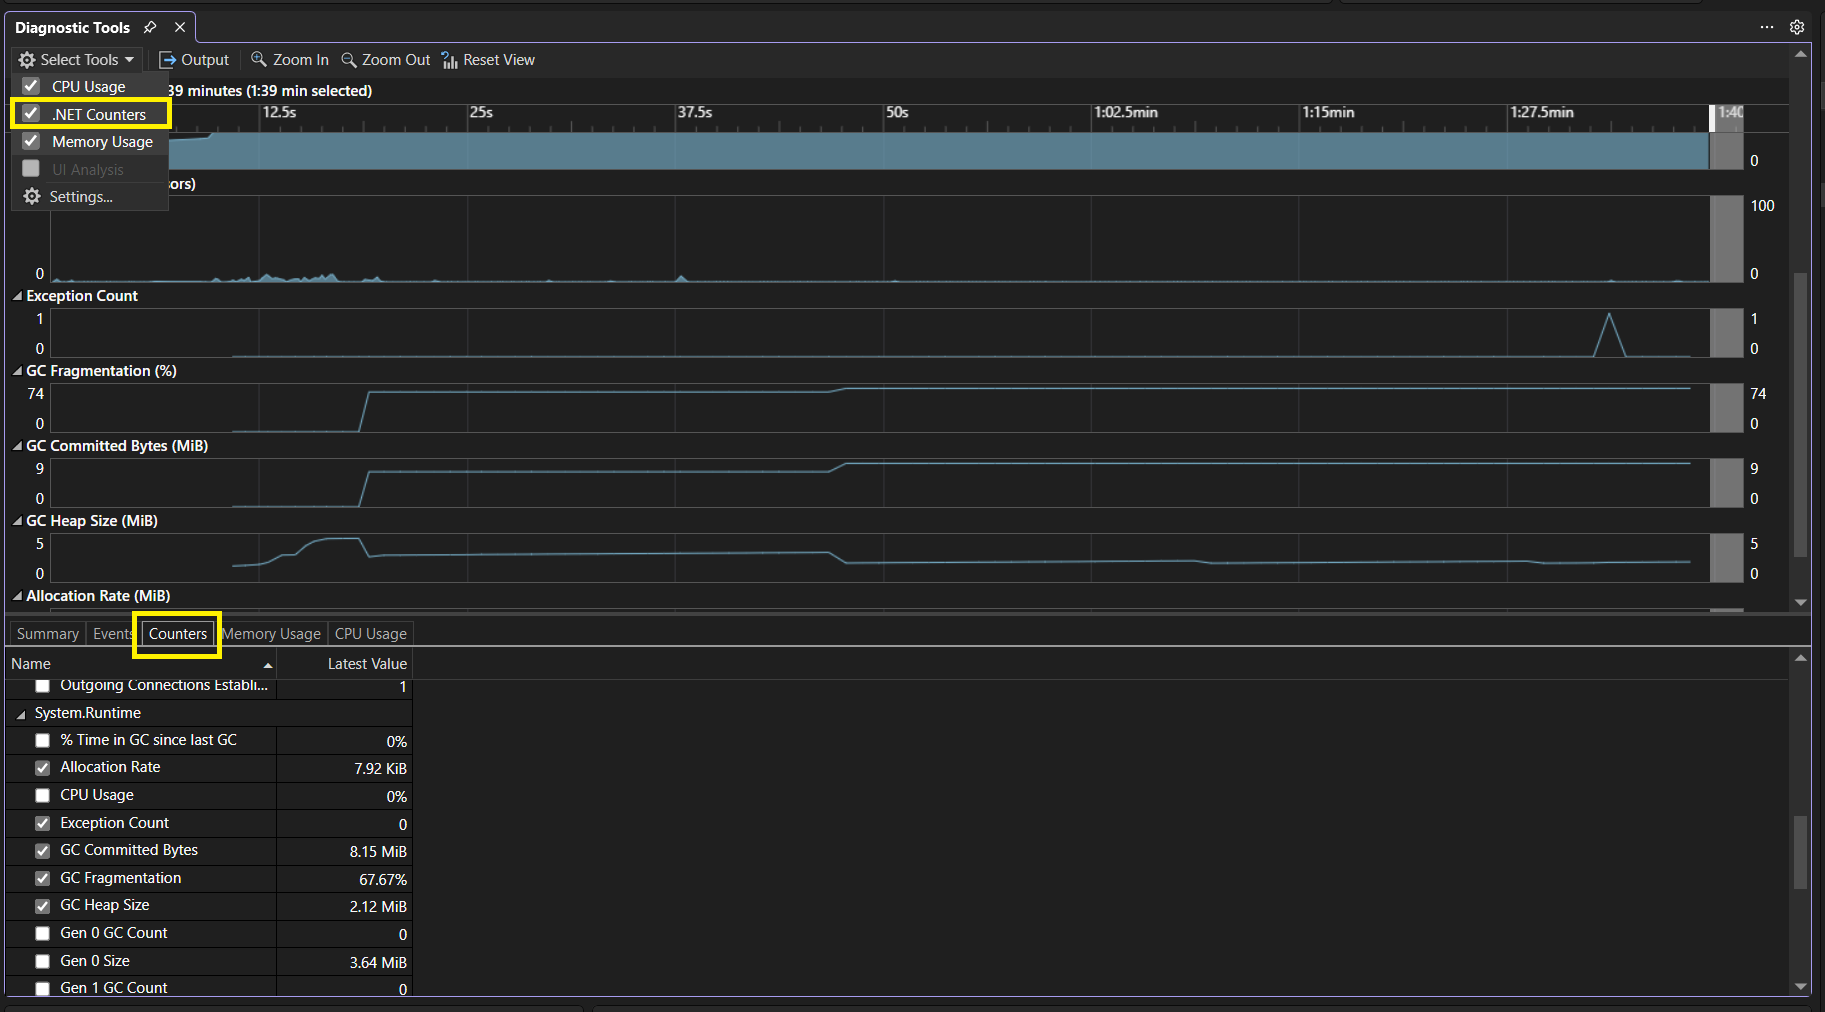
New Instruments via Meters API
.NET Counters tool brings integration with the .NET Meters API, introducing two new instrument options: “Counter” and “ObservableCounter”. The “Counter” keeps track of a value changing over time, with the caller reporting updates using “Counter<T>.Add.” In contrast, the “ObservableCounter” is like the Counter, but the caller takes care of keeping track of the total value.
You can find these metrics in the list of the .NET counter metrics roster, offering enhanced visibility into system performance and resource utilization. This feature was inspired by the Developer Community suggestion: Performance Profiler: .NET Counters should support custom counters
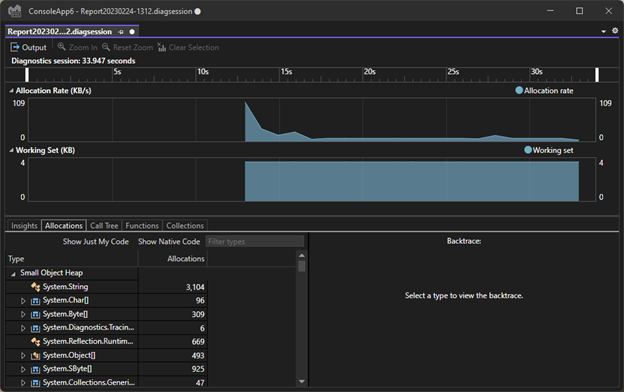
.NET Object Allocation tool
Additionally, the .NET Object Allocation tool has been enhanced to seamlessly import allocations from a .NET data provider through ETL file formats. This will help you analyze allocation events and monitor memory usage effectively.
Learn more about .NET allocation tool: Analyze memory usage for .NET objects
Profiler Live Graph for .NET on WSL
Profiling tools now support live graphs while collecting from dotnet-monitor for WSL. The WSL live metrics are available for .NET object allocation, CPU usage, and the .NET counter tool. While the tool is initially collecting data from dotnet-monitor for WSL you can see the real-time graphing for live counter information, then you can stop collecting and see detailed breakdown views of memory allocation, call trees, functions, collections, and other related data.
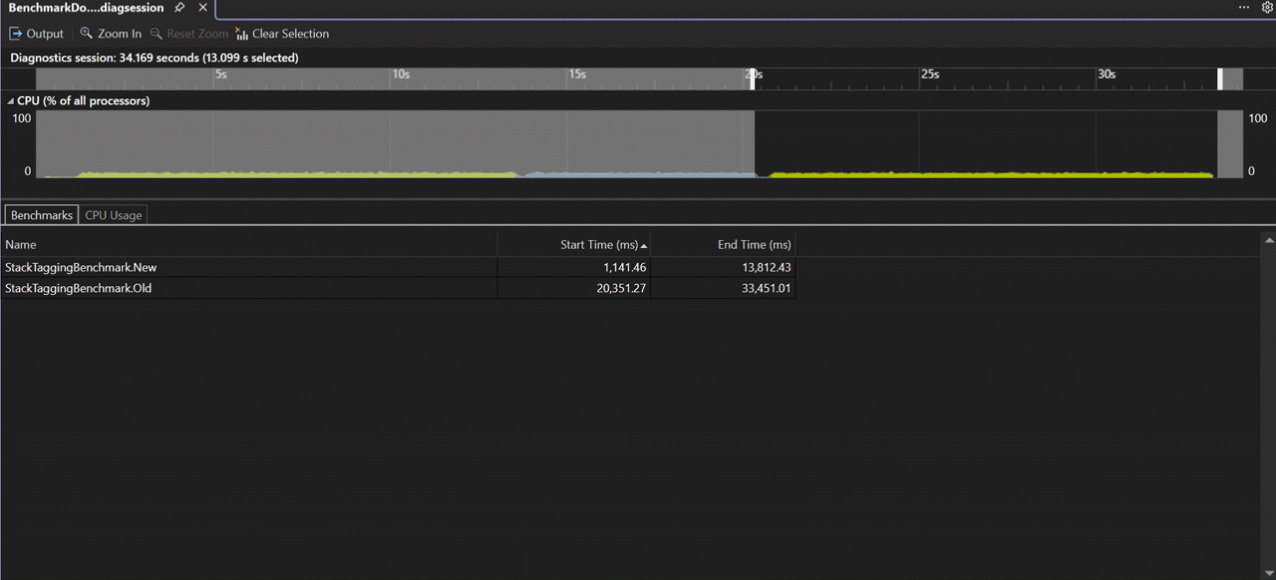
BenchmarkDotNet IDiagnosers
The Visual Studio Profiler has been upgraded to include support for BenchmarkDotNet IDiagnosers. These IDiagnosers are essential for efficiently gathering diagnostic data from BenchmarkDotNet scenarios.
The Benchmark tab offers a visualization of the executed benchmarks and provides the ability to precisely choose a benchmark from the swimlane by double-clicking on a specific row.

You can also navigate to the source file through the right-click context menu. The statistical data is sourced directly from BenchmarkDotNet and is presented in a structured grid format.
Test Profiling
We have introduced an updated Test Profiling capability in Visual Studio 2022. When you right-click on your test in Test Explorer and select “Profile,” you can now choose from a set of available tools, including CPU Usage, GPU Usage, File IO, .NET Async, and Events Viewer. Simply select the tools you want to use, click “Start,” and a report will be generated for you. This feature provides a powerful and convenient way to analyze the performance of your tests and identify potential issues. Learn more about Test Profiling from our recent blog: A unit of profiling makes the allocations go away – Visual Studio Blog (microsoft.com)
This feature is only available in our Visual Studio Enterprise Version. Download Here
Faster and More Reliable Profiling Tools
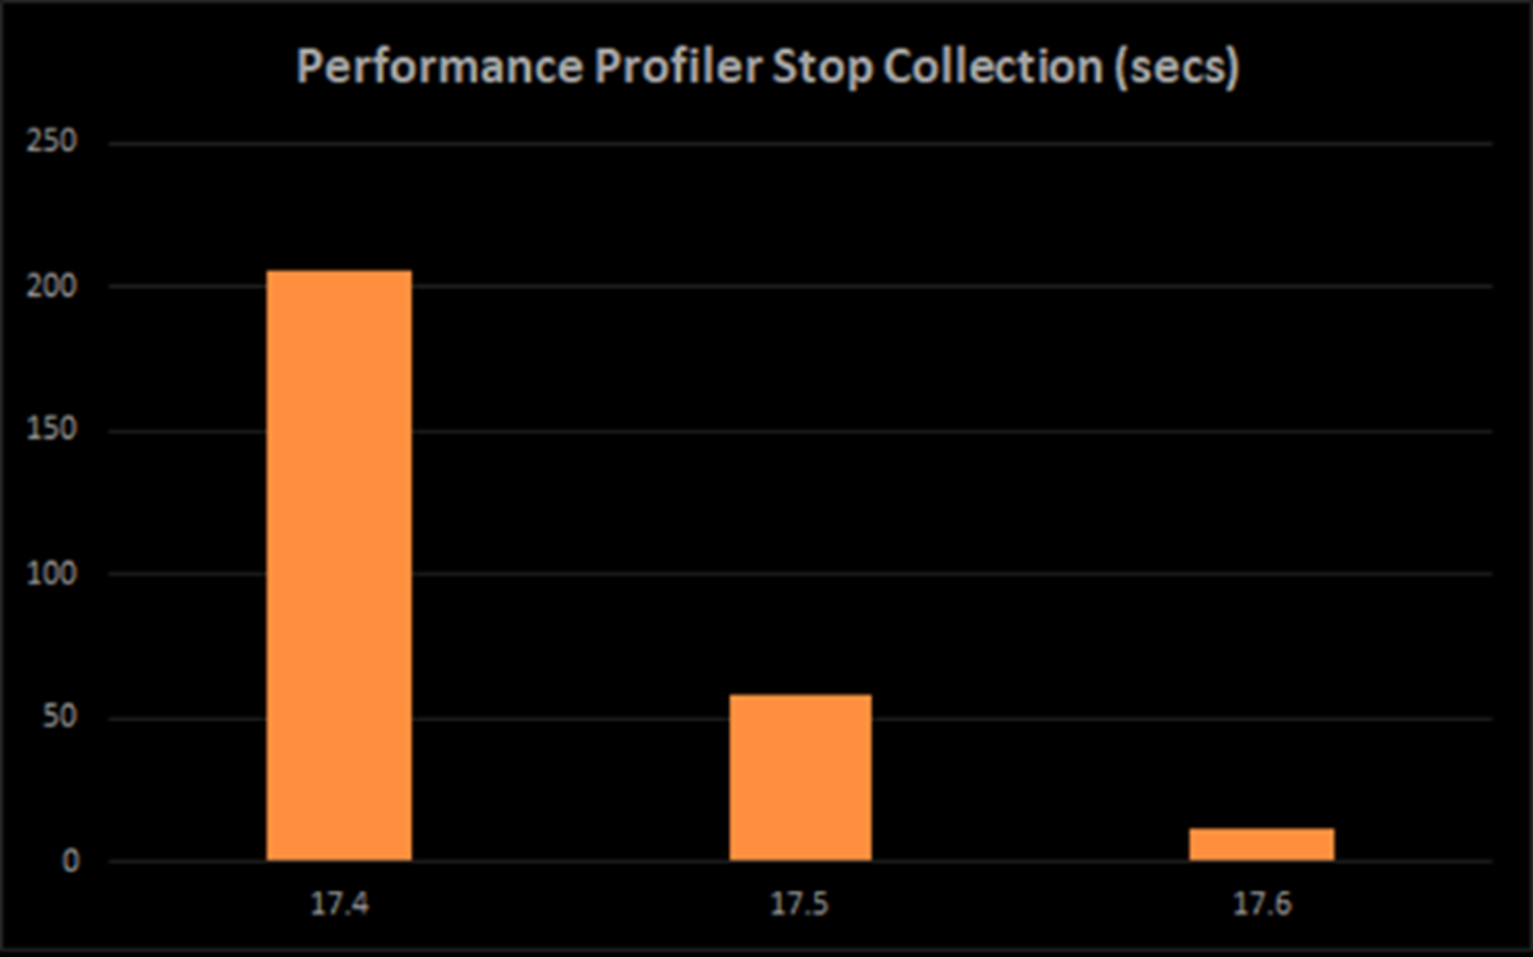
Our team has dedicated additional resources to enhance reliability and performance across various tools, with notable improvements in the Performance Profiler’s stop collection functionality. The stop collection now runs approximately 3.5 times faster when generating and almost 15 times faster when using cached values (which are always used if available). We’ve tested this using a 10-second trace in Visual Studio, and version 17.6 demonstrates a considerably faster performance than previous versions 17.5 and 17.4.
In the Summary
Thank you for entrusting us with your needs and aspirations. We will keep working on our Profiling tools to make your Profiling experience smoother and more efficient.
If you have any thoughts or suggestions, please share them with us on the Developer Community site. Your feedback is very important to us.
Learn more about these and other features in Visual Studio’s Profiling tool by checking out additional resources.
- Measure performance in Visual Studio – Visual Studio (Windows) | Microsoft Learn
- Visual Studio 2022 Release Notes | Microsoft Learn
- VS Profiling Series – Visual Studio Toolbox – YouTube
Stay connected with the Visual Studio team by following us on Twitter @VS_Debugger, Twitter @VisualStudio, YouTube, and LinkedIn.
The post A Look Back: Visual Studio’s Profiling Tool Advancements in 2023 appeared first on Visual Studio Blog.


